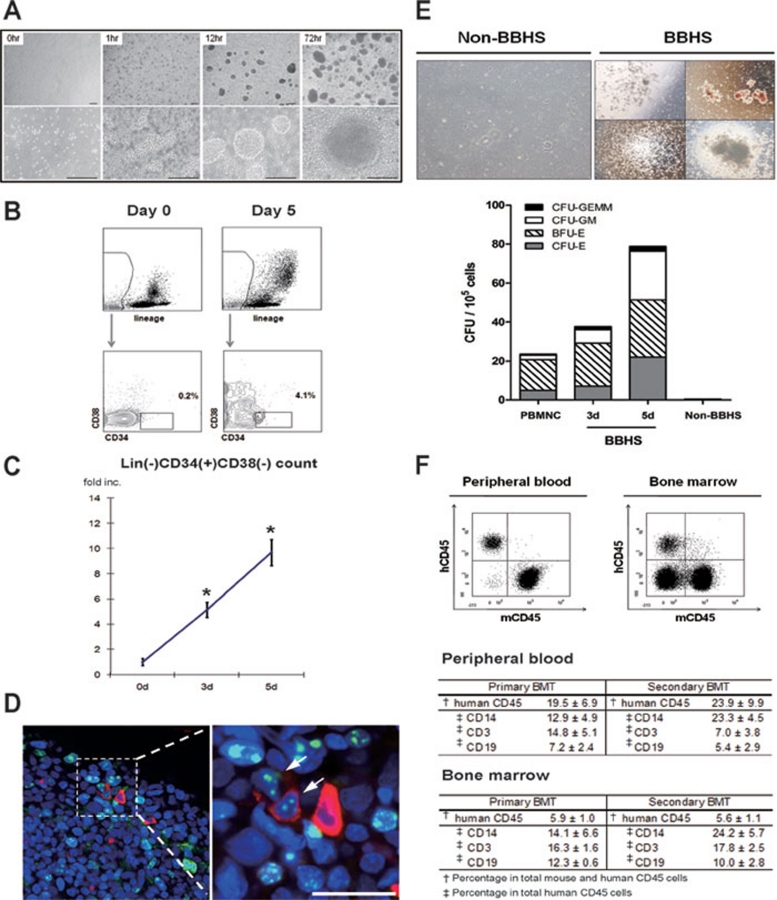
Figure 1.
(A) Optimized spheroid culture of MNCs. Each panel depicts representative field of BBHS culture at designated time point. Scale bars, 100 μm. (B) Identification of Lin(−)CD34(+)CD38(−) population in BBHS. The number indicates the percentage of CD34(+)CD38(−) population in Lin(−) population. (C) Expansion of Lin(−)CD34(+)CD38(−) population in BBHS. Absolute counts of Lin(−)CD34(+)CD38(−) HSPC in BBHS culture at day 3 and day 5 were normalized to HSPC count at the start of culture to calculate the expansion fold. These experiments were done nine times with MNCs from different donors. Asterisks (*) denote statistically significant change from day 0 (P < 0.05). (D) HSPC localization and proliferation in BBHS. Whole mount stained BBHS with CD34-positive cells (red) in proliferation (Ki-67, green). Arrows indicate double-positive cells. Nuclei were counterstained with To-Pro-3 (blue). Scale bar, 20 μm. (E) Expansion of functional hematopoietic progenitors exclusively in BBHS-spheres. CFU counts are shown for day 0 MNC, BBHS at day 3 and day 5. Non-BBHS cells were quantified on day 5. Top panel: left panel shows representative field of non-BBHS group in CFU assay. Bottom panel: CFU count of each group. (F) BBHS-derived HSPC with long-term hematopoietic repopulating capability in vivo. NOG-SCID mice were injected with single-suspended BBHS cells after partial bone marrow ablation (primary BMT, n = 4). After 12 weeks, peripheral blood, bone marrow and other organs were analyzed for hematopoietic cell chimerism and lineage differentiation. Top panel shows representative FACS results analyzing human and mouse CD45 chimerism. To investigate the long-term repopulating capacity of BBHS-derived HSPC, human HSPC from primary BMT mice were sorted and injected into NOG-SCID mice (secondary BMT, n = 2). Hematopoietic cell chimerism and human hematopoietic lineage differentiation were assessed as above after 12 weeks. Tables summarize the results. Numbers indicate the mean ± SEM of each experiment.

