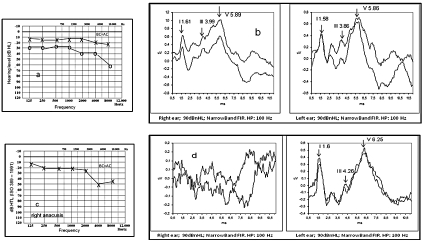
Fig. 3a-d.
Pure tone audiometry (a) and (b) first ABR performed April 2009; pure tone audiometry (c) showing right anacusis and mild left hearing loss mainly affecting high frequencies and ABR (d), both performed November 2009. NB. Absence of response in right ear and preserved morphology in left with prolonged inter-peak intervals mostly due to I-III interval (2.66 msec; nv < 2.4 msec) suggesting retro-cochlear involvement. (BC = AC: Bone Conduction = Air Conduction. x; left air conduction threshold).

