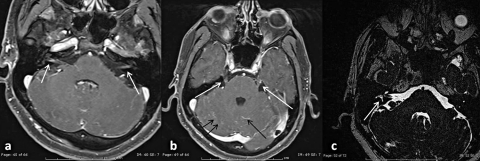
Fig. 4.
Gadolinium enhanced cerebral MRI. a) December 2009; Axial contrast- enhanced T1-weighted images showing enhancement along internal auditory meatus (IAM) bilaterally (a, white arrows); b and c: February 2010; b) Post-contrast T1-weighted images revealing diffuse enhancement of basal leptomeningeal, of trigeminal nerves (b, white arrows) and along the pial surfaces of the cerebellar folia (b, black arrows); c) T2-weighted images showing reduced signal intensity within the lateral and posterior semicircular canals (LSC and PSC) and cochlea on the right (c, white arrows).

