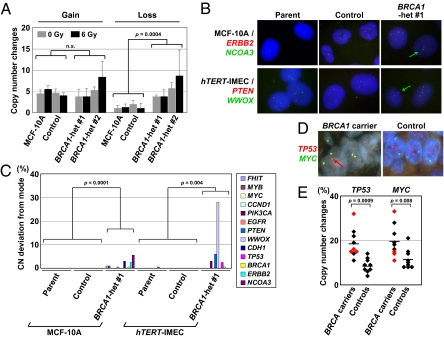
Fig. 4.
Increased genomic instability in BRCA1 heterozygous cells in vitro and in vivo. (A) MCF-10A–derived isogenic clones were exposed to 6 Gy or mock γ-irradiation and subjected to single-cell cloning. Single-cell subclones were analyzed with SNP arrays after 4 wk of culture, and genes exhibiting CN changes (< 1.5 or > 2.5) were counted (mean ± SD). (B and C) FISH analyses of 13 genomic loci in isogenic cell clones. (B) Representative FISH images. Red and green spots represent ERBB2 and NCOA3 gene loci in MCF-10A clones and PTEN and WWOX loci in hTERT-IMEC clones, respectively. Green arrows indicate cells carrying single-copy genes labeled with green fluorescence. (C) Percentages of cells with allelic counts deviated from the modes. (D and E) FISH analyses of TP53 and MYC gene loci in noncancerous breast epithelial tissues from BRCA mutation carriers and controls undergoing reduction mammoplasty. (D) Representative FISH images for a BRCA1 mutation carrier and a control. A red arrow indicates a single TP53 gene copy. (E) Percentage of cells undergoing CN changes. Red dots denote BRCA2 mutation carriers. Horizontal bars represent averages.

