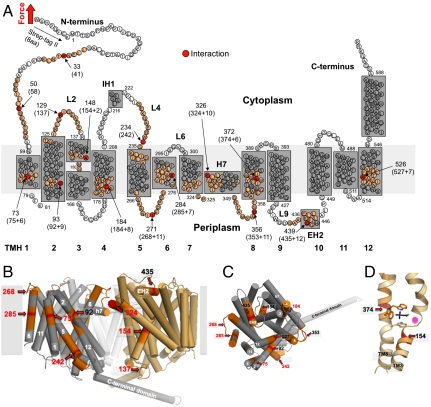
Fig. 2.
Mapping interactions on the secondary structure of BetP. (A) Interactions mapped onto the secondary structure. Red colored aa highlight interactions detected in Fig. 1. aa colored at less intensity approximate the full-width-at-half maximum (FWHM) of the average fp. Numbers at arrows give the structural position of the interaction detected. This structural position corresponds to the N-terminal Strept-tag II (8 aa) subtracted from the average contour length as revealed from the WLC fitting of individual fp (given in brackets). In case the interaction had to be assumed to lie within the membrane or at the opposite of the membrane a certain number of aa were added (indicated by +) to the contour length to structurally locate the interaction. This procedure called “membrane compensation” (16) is described in the SI Text. All 12 transmembrane α-helices (TMHs) of BetP were labeled with bold numerals. The short helices in loop4 and loop9 at the cytoplasmic and periplasmic sides were denoted IH1 and EH2, respectively. The amphiphatic α-helix H7 is thought to face the periplasm and to make contacts with TMH1, TMH2, and TMH9 and H7 of the other two BetP molecules forming the BetP trimer (12). (B) Side view on the BetP trimer (PDB entry code 2WIT) showing two adjacent protomers in cylinder presentation indicating molecular interaction sites detected by SMFS. TMHs are numbered in white and the contour lengths of fp are given in red or black. One protomer is colored in gray with labeled interaction sites in red according to (A). The membrane is shown as gray rectangle. (C) Top view on one protomer from the periplasmic side. (D) Central substrate-binding site of BetP with a betaine molecule in stick presentation colored in black located close to two interaction sites in TMH3 and TMH8.

