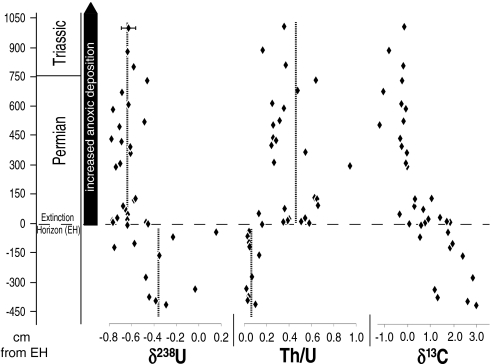
Fig. 2.
Geochemical profiles for the Dawen section. The vertical dashed lines represent average values of δ238U and Th/U for pre-EH and post-EH samples. The 238U/235U ratios are reported using standard δ-notation, where δ238U = [Ratiomeas/Ratiostd(SRM950a) - 1] × 1,000. Average 2 × standard deviation (2SD) uncertainty of δ238U values is shown on the top data point only for clarity. δ13C and stratigraphic data from ref. 14.

