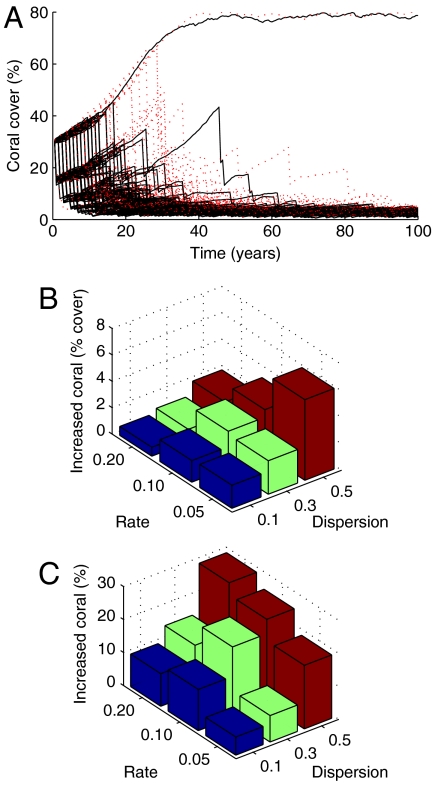
Fig. 3.
Impacts of clustered versus random hurricanes after a century of disturbance showing examples of individual reef trajectories (A). Increases in century-averaged coral cover under clustered events are expressed both in absolute units of cover (B) and in relative terms where the increase is given as a percentage of the mean century-averaged cover under random hurricane events (C). Individual trajectories (A) shown for a hurricane rate of 0.2 and comparison of randomly dispersed hurricanes (black) with those at an overdispersion of 0.5 (red).

