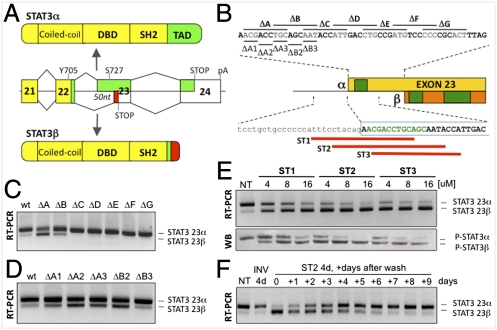
Fig. 1.
Modulation of STAT3 alternative splicing. (A) Alternative 3′ splice site use in exon 23 generates STAT3α or STAT3β, where the TAD (green) is substituted by a unique 7-aa tail (red). DBD, DNA binding domain. (B) STAT3 exon 23. Deletion mutants within the 50-nt α-specific region are indicated (Upper), as are the positions of the morpholinos (red lines) (Lower). The putative mapped ESEs are depicted in green. (C and D) RT-PCR analysis of STAT3 α/β levels in HeLa cells transfected with the 9-nt (ΔA–ΔG) or 3-nt (ΔA1–ΔB3) deletion mutants. (E) RT-PCR and Western blot analysis of STAT3 α/β levels in MDA-MB-435s cells treated with increasing concentrations of ST1, ST2, and ST3 for 4 d. NT, untreated. (F) RT-PCR analysis of STAT3α/β levels in MDA-MB-435s cells pretreated with either control (INV) or ST2 for 4 d and then grown in fresh media for up to 9 d.

