Fig. 4.
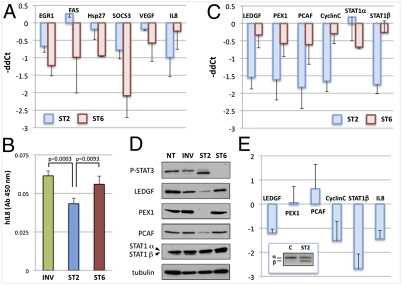
STAT3β switch modulates specific target genes. (A) MDA-MB-435s cells treated with 16 μM ST2, ST6, or INV for 4 d were analyzed by qPCR. Results are represented as a comparison between ST2 and INV (blue) or between ST6 and INV treatments (red), expressed as −ddC(t) values after normalization to hypoxanthine phosphoribosyl transferase (HPRT). Data represent the average of at least three independent experiments. (B) IL8 quantification by ELISA on conditioned media from MDA-MB-435s cells treated as in A (n = 4). P values were calculated by two-tailed Student's t test. To validate STAT3β targets identified by microarray analysis, cDNAs from A were analyzed as above by qPCR (C) and lysates were analyzed by WB, with α-tubulin as control (D). (E) Quantitative PCR analysis of STAT3β target genes from tumor RNAs from xenograft experiments in which tumors were injected IT twice in a week with vehicle (C) or ST2s. Results are represented as a comparison between ST2 and control, expressed as −ddC(t) values after normalization to β-2-microglobulin. Data are from at least three independent experiments. Bars represent SD. (Inset) RT-PCR analysis of STAT3 levels in the same RNAs.

