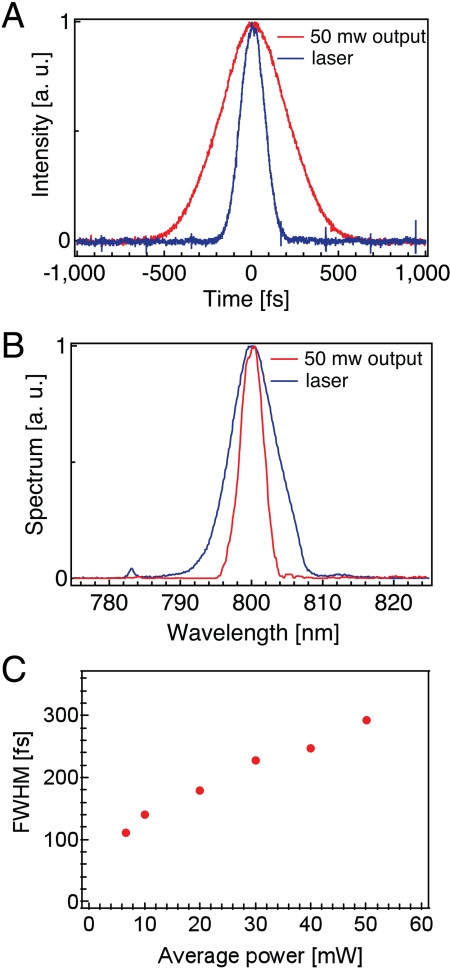
Fig. 2.
Pulse characterization. (A) Autocorrelation pulse-width measurements for the Ti:Sapphire output and for 50-mW endoscope output. The measured pulse widths are approximately 100 and 290 fs, respectively. (B) Spectra for the Ti:Sapphire output and for endoscope output at 50 mW. (C) Measured pulse widths of the endoscope output as a function of output power, assuming a deconvolution factor of 1.54 for a Sech2 pulse.

