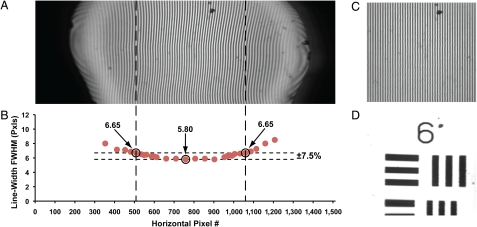
Fig. 4.
Raster scan uniformity characterization. (A) Transmission image of a 400 LP/mm Ronchi ruling (line width = 1.25 μm). (B) Plot of the measured line widths of the Ronchi ruling as a function of the horizontal pixel number across the image. A horizontal range of approximately 110 μm corresponds to a line-width deviation of ± 7.5%. (C) Cropped and postprocessed Ronchi ruling image from Fig. 4A (FOVxy≈110 μm × 110 μm). The Ronchi ruling lines in C are corrected to be of uniform width across the image FOVxy. (D) Cropped and postprocessed transmission image of USAF test target group 6, elements 2–3 (line widths: 7.0 to 6.2 μm, FOVxy≈110 μm × 110 μm).

