Fig. 5.
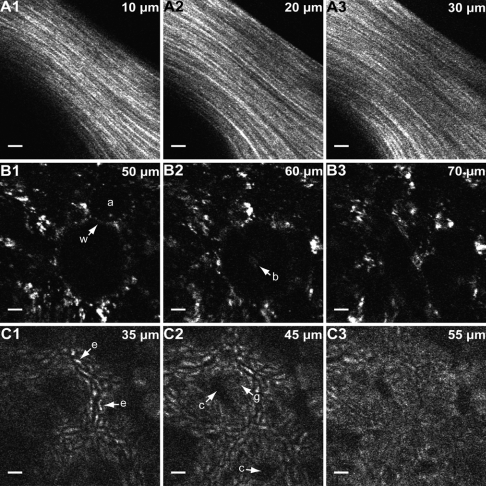
TPF/SHG images of ex vivo mouse tissue. (A) Unaveraged SHG images of mouse tail tendon at 10, 20, and 30 μm from the surface. (B) Unaveraged intrinsic fluorescence images of mouse lung at 50, 60, and 70 μm from the tissue surface. In B1, alveolar walls (w) and lumens (a) are clearly visible; in B2, a bronchiole (b) is distinguishable. (C) Five frames averaged intrinsic fluorescence images of mouse colon at 35, 45, and 55 μm from the surface. In C1, enterocytes (e) are visible; in C2, crypts (c) and goblet cells (g) are present. Scale bars, 10 μm. All images were acquired at 4.1 frames/second, 800-nm excitation, and the uniformly sampled FOVxy of approximately 110 μm × 110 μm is displayed. For the images in A, the power at the sample is approximately 30 mW; for the images in B and C, the power at the sample is 75 mW.

