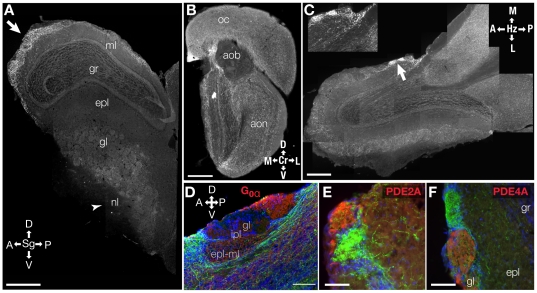
Figure 2. Micrographs of main olfactory tissue from Chat-GFP mice show diffuse labeling throughout the bulb with some regions of high labeling in the GL.
A–C . High-resolution composite micrographs (shown for visualization only) of MOB tissue. Plane orientation: Sg - sagittal, Cr - coronal, Hz - horizontal; a = anterior, p = posterior, d = dorsal, v = ventral, l = lateral, m = medial. Layer labels: nl - nerve; gl - glomerular; epl - external plexiform; gr - granule cell; ml - mitral cell; ipl - internal plexiform. Scale bar indicates 500 µm. A. Parasagittal section. Arrow points to region of relatively heavy GFP labeling in the anterior region of the bulb. Arrow head indicates region where relatively little labeling is found. B. Coronal section. oc - orbital cortex. aob - accessory olfactory bulb. aon - anterior olfactory nucleus. C. Micrograph of a coronal cross-section of the MOB and AOB. Arrow points to heavily staining glomeruli shown in inset. C inset . High-resolution micrograph of glomeruli with a relatively high amount of GFP staining. D . High-resolution micrograph of the AOB showing that the relatively light GFP staining in the anterior portion of the structure did not co-label with Goα labeled in red. E–F . Heavily-stained GFP glomeruli do not co-label with PDE 2A (E) or PDE 4A (F). Red = PDE#A, Green = GFP. Scale bar = 100 µm.

