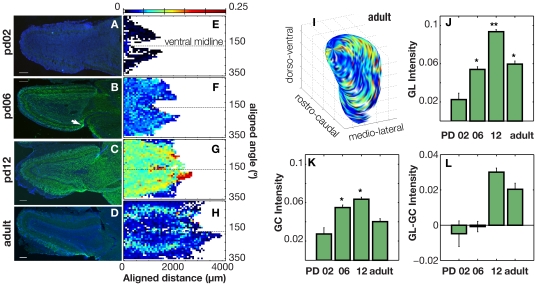
Figure 3. The pattern and intensity of GFP staining in the GL and GCL of the MOB across different developmental stages in ChAT-GFP mice.
A–D. Representative cross-sections of MOB cut horizontally from four different age groups: Post-natal day (PD) 02, 06, 12, and adult. Scale bar indicates 100 µm. E–H Average intensity maps of GFP-staining across the glomerular surface of each MOB. Abscissa: rostro-caudal position realigned to the standard bulb where 0 µm corresponds to the anterior end of the bulb. Ordinate: cylindrical coordinates realigned so that 0° corresponds to dorsal, 90° to lateral, 180° to ventral, 270° to medial surfaces of the bulb. The color bar indicates the level of corrected green intensity in the GL of the MOB with warm colors indicating higher levels of green intensity. I. Intensity map from H overlaid on a standardized, three-dimensional representation of the inner GL of the MOB showing the heterogenous staining pattern on the lateral surface of the bulb. Axes range: d – dorsal, v- ventral; r – rostral, c – caudal; m – medial, l – lateral. J–L. Changes in GFP intensity in the glomerular (GL) and granule cell (GC) layers of the bulb across age groups. J. The level of GFP intensity in the GL layer significantly increases up to post-natal day (PD) 12 and then decreases in adult animals (Anova p-value: 3×10−36). A multiple comparison test using Tukey's HSD criterion shows: ** PD12 mean GL intensity is significantly greater than all other age groups. * PD06 and Adult mean GL intensities are significantly greater than PD02, but significantly lower than PD12. They are not significantly different from each other. K. The level of GFP intensity in the GC layer significantly levels out at PD6 and then decreases in adult animals (Anova p-value: 3×10−36). L. GC intensity subtracted from GL intensity highlighting the change in relative intensity between GC and GL during development.

