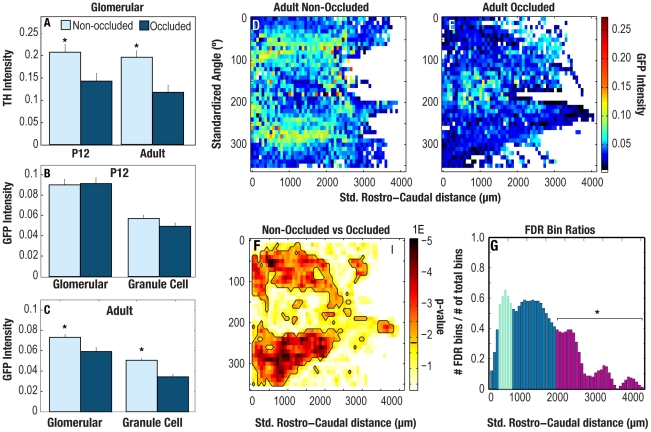
Figure 5. Naris occlusion abolishes differential GFP staining pattern in adult animals.
A. Significantly lower TH Intensity in occluded bulbs as compared to non-occluded bulbs confirmed that the occluded bulbs had reduced olfactory activity in both PD12 animals and adult animals (t-test, p-value = 1×10⁻² and 3.6×10⁻⁴, respectively). B. PD12 animals: mean GFP intensity did not vary significantly between occluded and non-occluded bulbs in either the glomerular or granule cell layers of PD12 bulbs. C. Adult animals: mean GFP intensity fell significantly in both the glomerular and granule cell layers in the occluded bulbs of adult animals (t-test, p-values: 2.2×10⁻³ and 2.4×10⁻⁸, respectively). D–E. Average intensity map in the occluded bulb (E) showed a markedly reduced differential patterning of GFP intensity throughout the GL as compared to the non-occluded bulb. F. p-value map generated from a binwise Mann-Whitney U test where p-value is indicated by color. Statistically significant p-values that fall below the false discovery rate (0.02, as indicated by the black line on the color bar) are circumscribed in black. These circumscribed bins indicate regions of the glomerular layer that differ significantly in GFP intensity between the occluded and non-occluded bulbs. G. The ratio of statistically significant bins per column of positive bins in the U-test map increases from the caudal end of the bulb towards the rostral end as discussed in the text. Magenta- colored bars (indicated by * line) in the bar plot differ significantly from the mean of the green bars (paired-ratio t-test, corrected for multiple comparisons using the false discovery rate, p-value = 0.0071).

