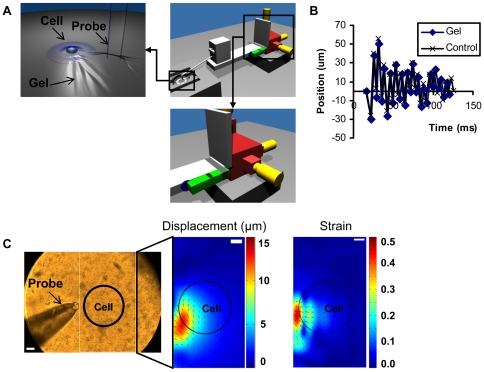
Figure 1. Mechanical stimulation equipment and vibration characterization.
(A) Diagrams of vibration stimulation equipment with different components: XYZ stage (red), micrometers (yellow), mass-spring system (green) that generates the vibration and spacer (blue) used to trigger the vibration. The left image shows the cell stimulation caused by the vibration of the probe tip inserted in the flexible substrate gel. The right image shows the vibration generation part. (B) The time course of probe tip displacement when positioned in gel (Gel) or out of the gel (Control). (C) The left image shows the probe and gel substrate with 1 µm beads embedded. The right images show a typical displacement (in µm) and strain maps, with the cold and hot color representing the small and large displacement/strain, respectively. In both colormaps, the vectors represent the displacement directions on the substrate. The black circle represents the typical position of a cell (∼125 µm of diameter) during stimulation experiments. The bars represent 25 µm.

