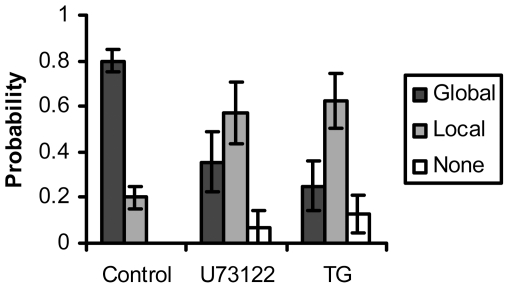
Figure 4. PLC and ER calcium mediate the calcium response upon mechanical stimulation.
The bar graphs represent the percentage of cells with global, local or none responses under different treatment as indicated, with the error bars representing the respective standard deviations. Thapsigargin (TG, ER calcium pump inhibitor): p = 1×10⁻⁵, U73122 (PLC inhibitor): p = 7×10⁻⁴. The statistical difference from the control group is determined by p<0.05. All results were significantly different from control.

