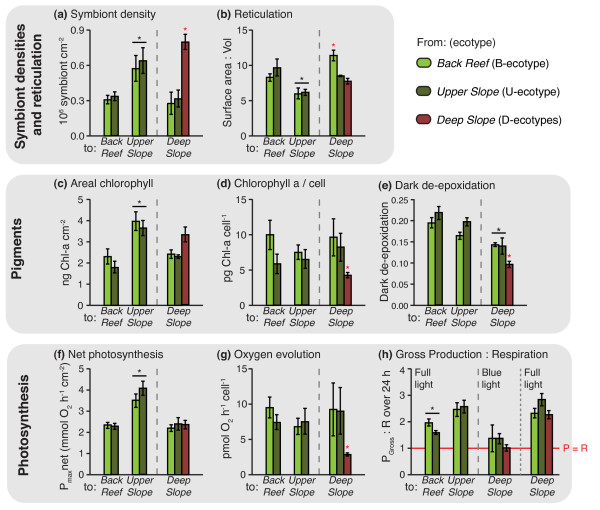
Figure 5.
Photo-physiological responses after transplantation. (a) Symbiont density, (b) Reticulation, (c) Areal cholorphyll a, (d) Chlorophyll a/cell, (e) Dark de-epoxidation, (f) Net photosynthesis (in full light), (g) Oxygen evolution/cell, (h) Gross production to respiration over 24 h. Colours indicate source habitat and x-axis indicates destination habitat. Error bars indicate ± SEM. Asterisks indicate significant differences in the one-factorial (red asterisk above individual bar) and two-factorial (black asterisk with line across two bars) analyses.

