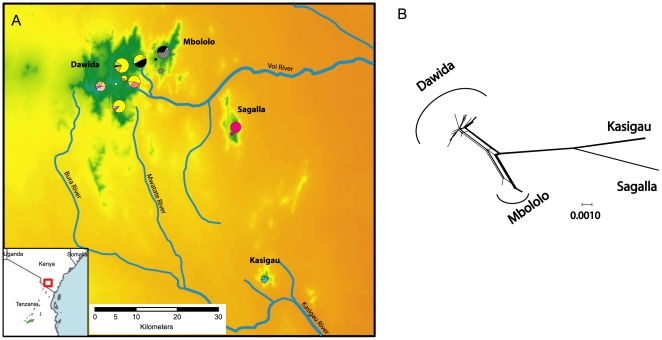
Figure 3. Sampling localities, haplotype frequencies and haplotype network for Kinyongia boehmei from the Taita Hills, Kenya.
A) The distribution of sampling localities within the Taita Hills, Kenya (inset). Topography is shown from green (highest) to orange (lowest) with major rivers labelled. Circles are proportional to number of individuals sampled and segments within the circles represent haplotypes. Note the presence of Mbololo haplotypes (black) in the northern areas of Dawida. B) ND2 network visualised using the NeighborNet algorithm with secondary contact omitted. Each line represents the connection between two haplotypes with the thicker lines representing many connections.

