
FIGURE 1.
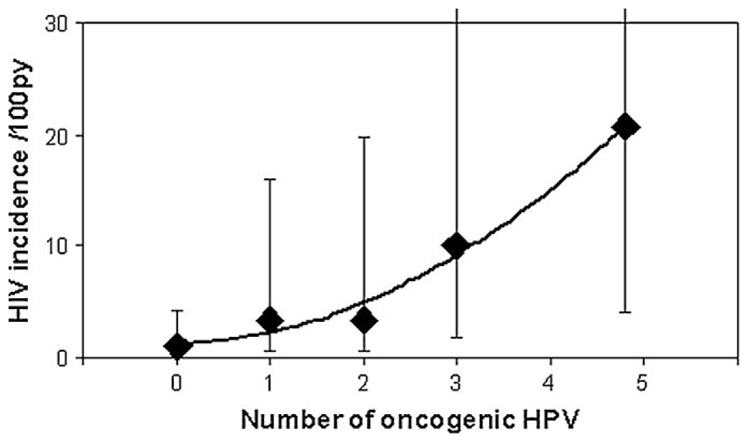
Distribution of HIV incidence as a function of the number of high-risk human papillomavirus genotypes.
py indicates person-year.
The data for the number of HR-HPV from 4 to 8 have been combined. The error bars represent the 95% confidence interval of the HIV incidence. A 2nd degree polynomial curve has been fitted to the graphics.