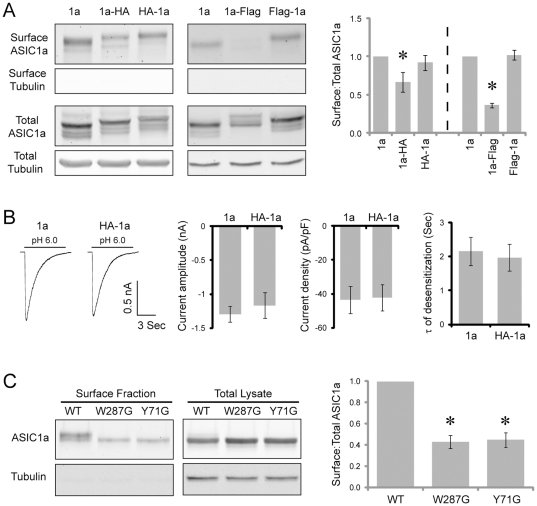
Figure 2. Mutating Tyr71 and Trp287 reduces ASIC1a surface expression.
(A) The effect of N- and C-terminal tags on surface expression of ASIC1a. CHO cells were transfected with untagged, N-terminal or C-terminal HA- or Flag-tagged ASIC1a as indicated. Surface and total proteins were blotted with a goat anti-ASIC1 and a mouse anti-tubulin antibody, as described in the Methods. Right panel shows the quantification of the surface:total ratio of untagged and tagged ASIC1a. The dotted line indicates that the controls for HA and Flag tagged experiments were different. Average surface:total ratio for WT was 4.4%±0.5%. For easy comparison, the ratio of WT was set arbitrarily to 1. (B) Typical traces and quantification of pH6-activated current recorded from cells expressing untagged (n = 6) or N-terminal HA-tagged (n = 7) ASIC1a. (C) Western blot and quantification showing surface:total ratio of HA-tagged wild-type ASIC1a, W287G, or Y71G mutants. Asterisks indicate a significant difference from controls (P<0.01, unbalanced ANOVA).

