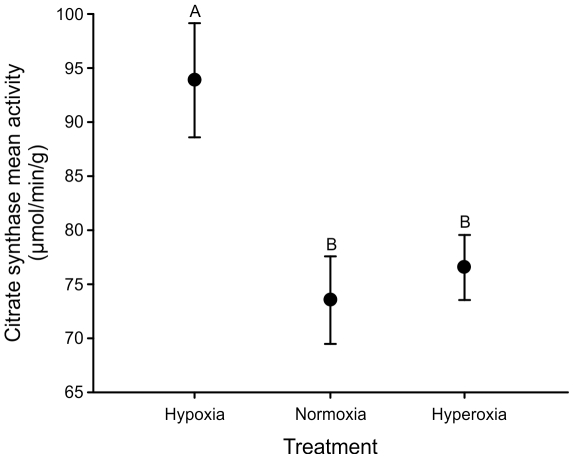
Figure 7. Variation among treatments in mitochondrial citrate synthase activity as measured in males at generation 29(24 hyperoxia).
D. melanogaster populations evolved under normoxic, hypoxic, or hyperoxic conditions and were then raised in a common normoxic environment for two generations prior to conducting the assay. Treatment means ± SEM of replicate populations are shown for clarity. The treatment effect was significant overall (p = 0.002) and those not sharing a letter are statistically different in a post-hoc comparison.

