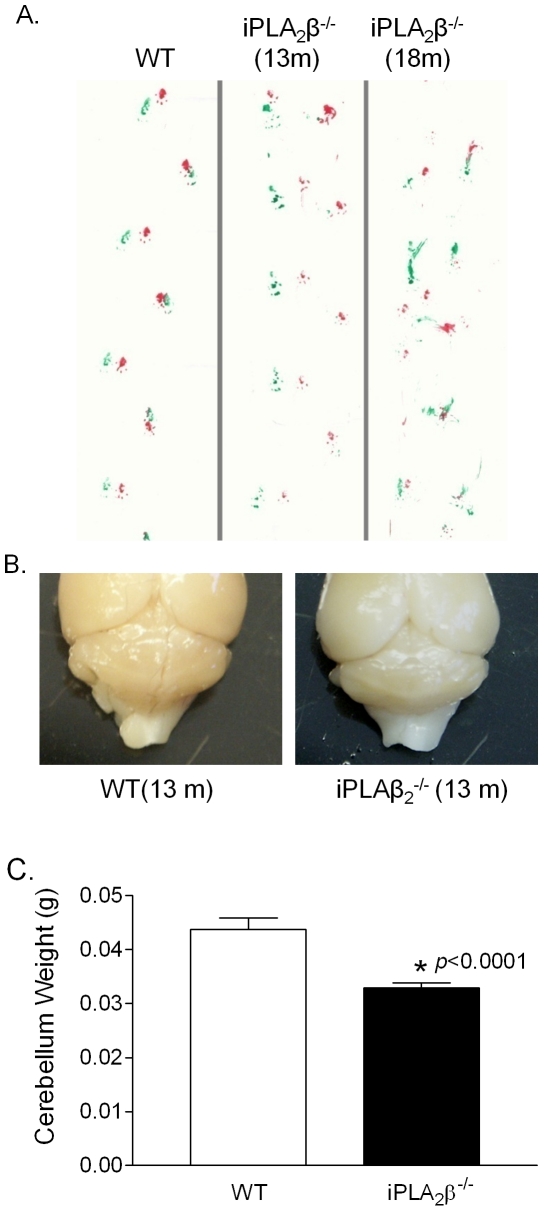
Figure 1. Ataxia and cerebellar atrophy in the iPLA2β-/- mouse.
A. Representative footprint patterns in gait stride tests of WT and iPLA2β-/- mice. B. Representative cerebellum of iPLA2β-/- mouse. C. Cerebella from the iPLA2β-/- mice (13–18 months) and the age-matched WT mice (n = 15/group) were weighted and statistically analyzed.* p<0.0001.

