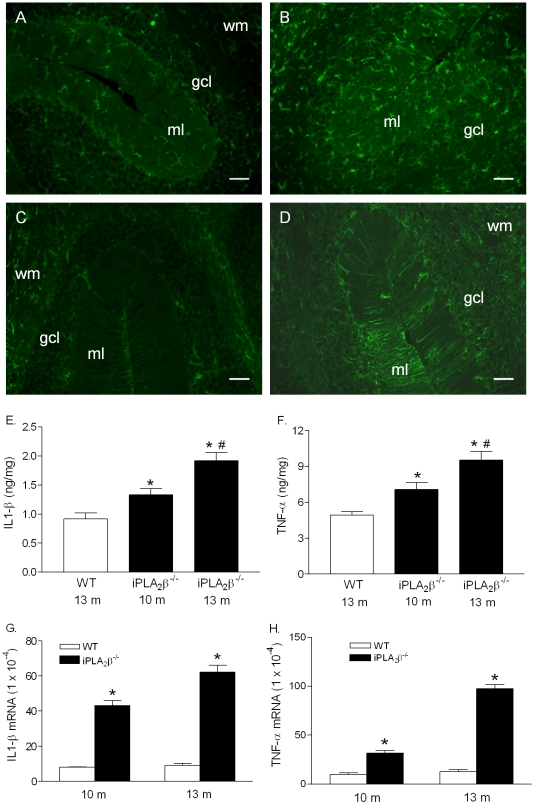
Figure 6. Glial cell activation and elevation of IL-1β and TNF-α in the cerebella of the iPLA2β-/- mice before apparent cerebellar atrophy.
A. Representative Iba-1 staining in the cerebella of the WT mice (10-month, n = 3) and (B) in the cerebella of the iPLA2β-/- mice (10-month, n = 6). C. Representative GFAP staining in the cerebella of the WT mice (10-month, n = 3) and (D) in the cerebella of the iPLA2β-/- mice (10-month, n = 6). Scale bar, 100 µm. E. Cerebella IL-1β levels (n = 4 in each group). F. Cerebellar TNF-α levels (n = 4 in each group). G. Cerebella IL-1β mRNA levels (n = 3 in each group). H. Cerebella TNF-α mRNA levels (n = 3 in each group). * vs. the WT, p<0.01; #vs. the 10-month iPLA2β-/- mice, p<0.01.

