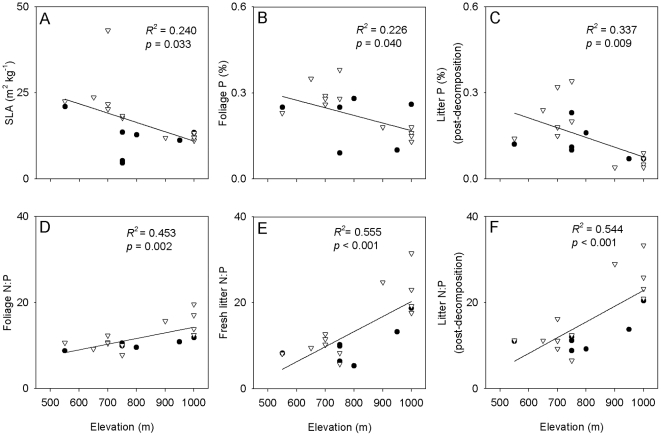
Figure 1. Relationships of leaf and litter traits with elevation across 18 species from heath and meadow.
Each species represents a single data point; for each species, the value presented for each leaf and litter trait is the mean for that species across all elevations, and the value presented for elevation is the mean elevation in which that species occurs. Traits are (A) SLA, (B) leaf P concentrations, (C) litter P concentrations post decomposition, (D) leaf N:P ratios, (E) fresh litter N:P ratios and (F) litter N:P ratios post decomposition. White triangles are meadow species; black circles are heath species.

