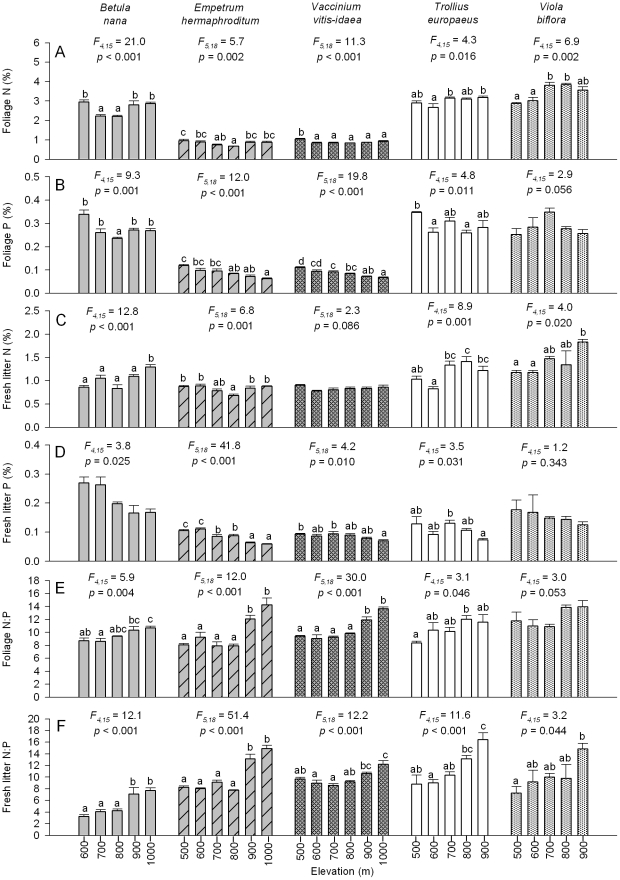
Figure 2. Foliar and fresh litter %N, %P, and their ratios, within species across an elevational gradient.
Measures are performed on each of five dominant plant species, three from heath (B. nana, E. hermaphroditum and V. vitis-idaea) and two from meadow (T. europaeus and V. biflora). Measures are (A) foliage N (%), (B) foliage P (%), (C) fresh litter N (%), (D) fresh litter P (%), (E) foliage N:P ratio and (F) fresh litter N:P ratio. For each response variable for each species, F and p-values (with df) are from a one-way ANOVA testing for the effect of elevation, and bars topped with the same letters are not significantly different at p = 0.05 (Tukey's h.s.d.). Note, for fresh litter P (%) for B. nana (D) ANOVA yields a significant main effect of elevation but there is no significant difference across elevations according to Tukey's h.s.d.

