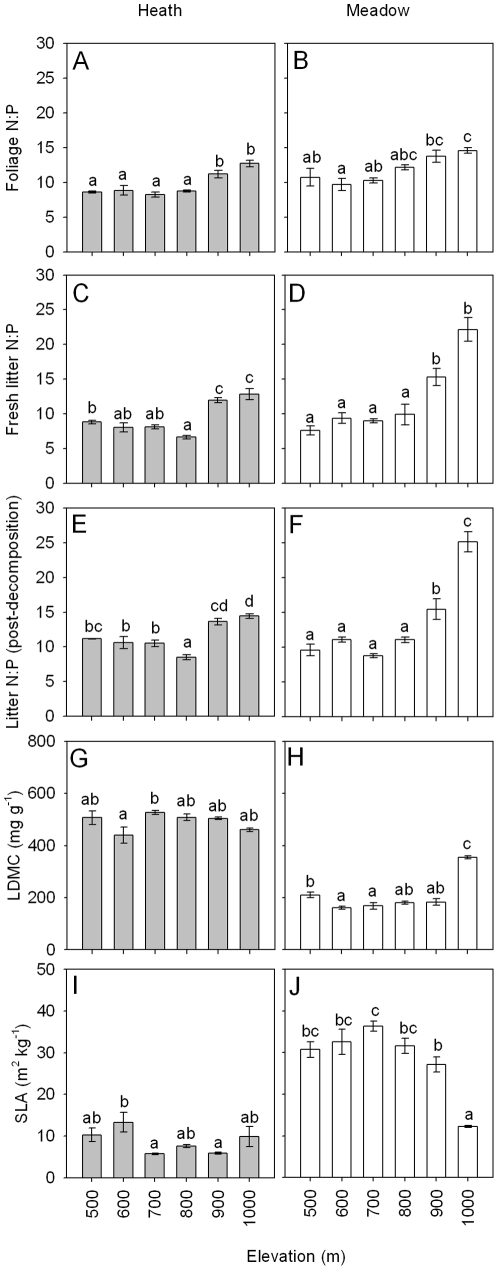
Figure 4. Whole plot foliar and litter traits in heath and meadow vegetation across an elevational gradient.
Traits are ratios of N to P in foliage (A–B), fresh litter (C–D), decomposed litter (E–F) and leaf dry matter content (LDMC) (G–H) and specific leaf area (SLA) (I–J) at the whole plot level, with all species collected in each plot weighted according to their relative abundance to provide a single value for each plot. Error bars are standard errors. Within each panel, bars topped with the same letters are not significantly different at p = 0.05 (Tukey's h.s.d.). Results from ANOVA testing for differences between the two vegetation types are given in Table 1.

