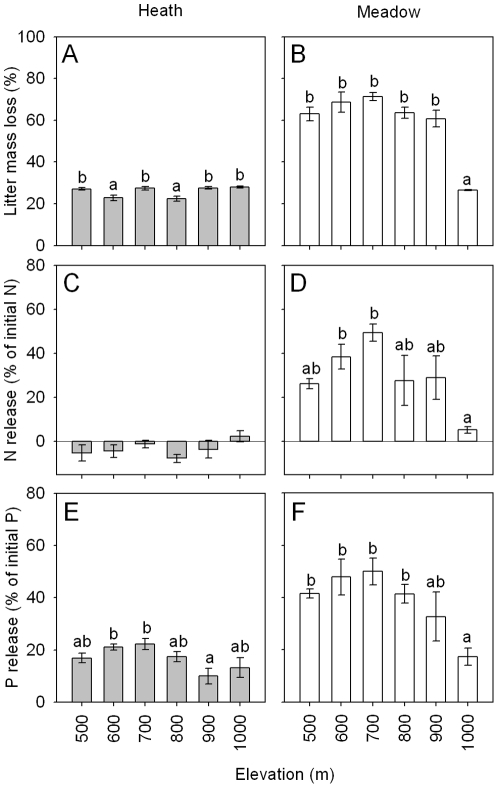
Figure 5. Whole plot measures of decomposition in heath and meadow vegetation across an elevational gradient.
Measures are (A–B) litter mass loss, (C–D) N and (E–F) P loss during decomposition calculated at the whole plot level, with all species collected in each plot weighted according to their relative abundance to provide a single value for each plot. Error bars are standard errors. Within each panel, bars topped with the same letters are not significantly different at p = 0.05 (Tukey's h.s.d.). For release of N from litter during decomposition, negative values reflect immobilization of N. Results from ANOVA testing for differences between the two vegetation types are given in Table 1.

