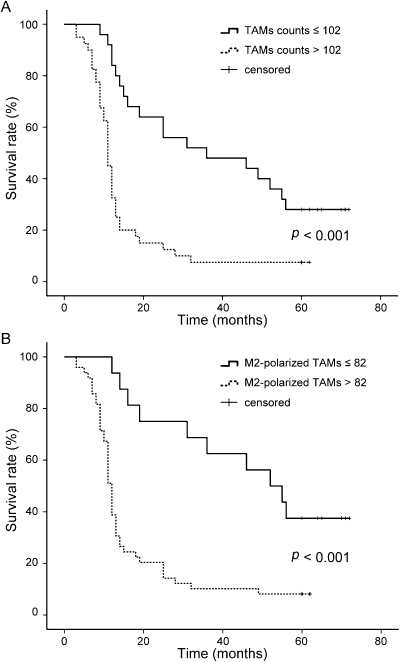
Figure 4.
Kaplan-Meier curves for overall survival by TAM count (A) and M2-polarized TAM count (B) in patients with lung adenocarcinoma. A shows the difference in the overall survival rate between the high and the low TAM count groups (p<0.001). B shows the difference in the overall survival rate between the high and the low M2-polarized TAM groups (p<0.001).

