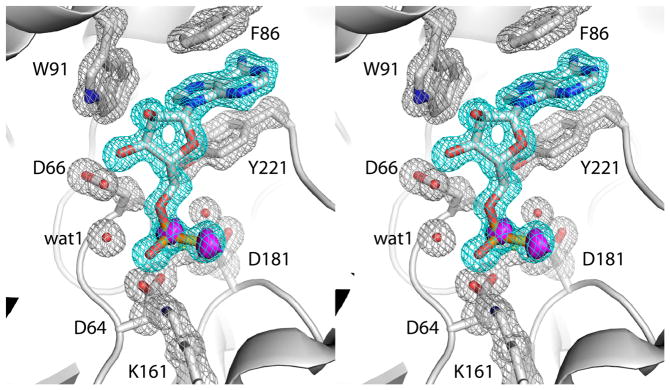
Fig. 2.
Electron density maps showing the presence of AMPS in the active site (relaxed stereographic view). The cage (cyan for the ligand, silver for protein side chains) represents a simulated annealing σA-weighted Fo - Fc omit map contoured at 3.0 σ. Prior to map calculation, the ligand and surrounding residues and water molecules were removed, and simulated annealing refinement was performed using PHENIX. The magenta surface represents an anomalous difference Fourier map contoured at 3.0 σ. Note that this map exhibits peaks corresponding to the P and S atoms of the thiophosphoryl.

