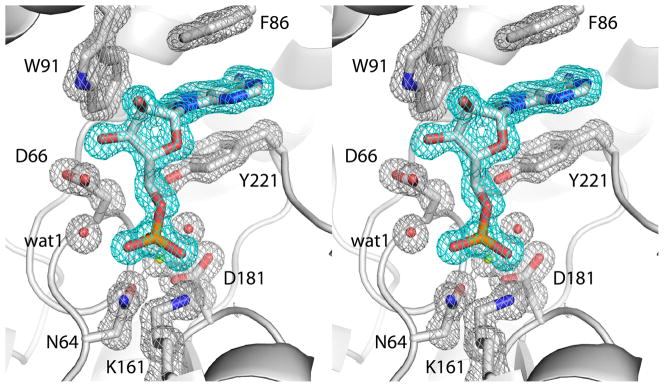
Fig. 4.
Electron density map showing the presence of 5′-AMP in the active site of D64N (relaxed stereographic view). The cage (cyan for the ligand, silver for protein side chains) represents a simulated annealing σA-weighted Fo - Fc omit map contoured at 3.0 σ. Prior to map calculation, the ligand and surrounding residues and water molecules were removed, and simulated annealing refinement was performed using PHENIX.

