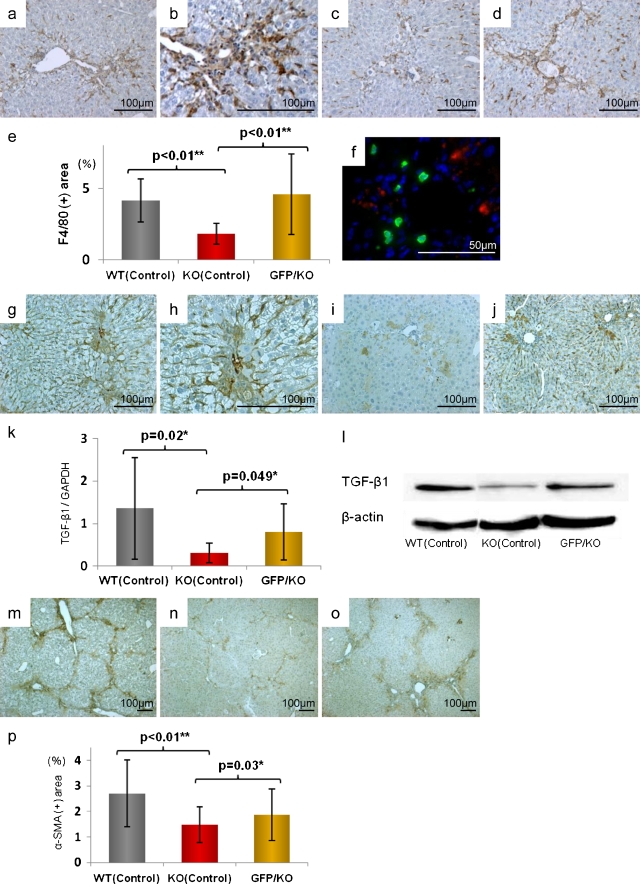
Fig. 4.
Alteration of F4/80-positive cell infiltration, TGF-β1 expression, and hepatic stellate cell activation. a–d Immunohistochemical analysis of F4/80 (original magnifications, ×100). e Statistical analysis of F4/80 positive area. Scale bars standard deviations. Compared with WT (Control) (a) [magnified figure (×200) (b)], the invasion of F4/80 positive cells was markedly suppressed in KO (Control) (c) and significantly increased in GFP/KO (d). f Double fluorescent immunohistochemistry of GFP and F4/80 (original magnifications, ×400). GFP was marked with FITC (green) and F4/80 with Cy3 (red). This showed the mismatch between the GFP-positive area and that of F4/80. g–j Immunohistochemical analyses of expression (original magnifications, ×100). WT (Control) (g) [magnified figure (×200) (h)] had much expression, but in KO (Control) (i), it was suppressed. Adversely, GFP/KO (j) had more TGF-β1 expression than KO (Control). k Real-time RT-PCR analyses of TGF-β1. l Western blot analyses using TGF-β1 antibody. Both showed the increase of TGF-β1 expression in GFP/KO, suppressed in KO (Control). m–o Immunohistochemical analyses of α-SMA (original magnifications ×40). p Statistical analysis of α-SMA positive area. Scale bars standard deviations. Compared with WT (Control) (m), KO (Control) (n) had less hepatic stellate cell activation, but the activation was markedly increased in GFP/KO (o)

