
Figure 3.
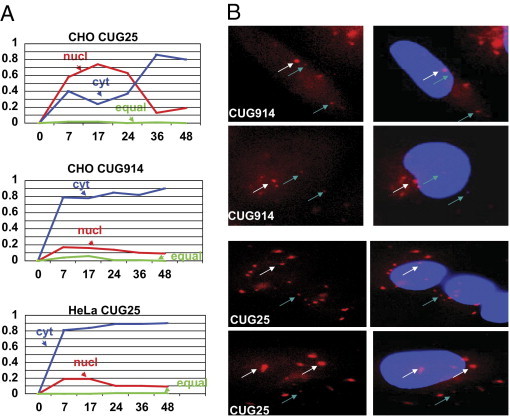
The kinetics of the accumulation of short and long CUG repeats in the nuclei and in cytoplasm. A: Number of cells with the preferentially nuclear and cytoplasmic foci was determined after the single transcription pulse of CUG914 and CUG25 RNAs as described in Materials and Methods. X shows time points (hours) after Dox addition at which cells with the CUG-positive foci in the nuclei and in cytoplasm were counted. Y shows the ratios of the number of cells with nuclear (red), cytoplasmic (blue), or equal number of foci (green) relative to the total number of cells with foci counted as 1. Small and large foci (shown in B by arrows) were counted to determine the portion of the cells with preferentially nuclear and cytoplasmic foci. B: Magnified images (×100) of the CUG914 and CUG25 foci in CHO cells are shown. White arrows point to large foci, whereas blue arrows point to small foci.