
Figure 6.
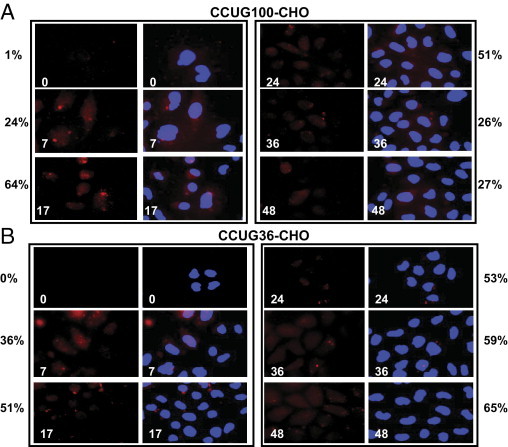
Kinetics of aggregation of CCUG100 and CCUG36 RNAs after transcription pulses in Tet-On CHO monoclonal cell lines. Foci formed by long (A) and short (B) CCUG repeats were detected by FISH assay with CAGG probe (red). Nuclei were stained with DAPI (blue). Images of FISH and overlay of FISH with DAPI staining are shown. Images were taken at brightness 10-fold higher than in Figure 7 to compensate for a weaker signal in CHO cells. Numbers on images (shown in white) indicate time points after Dox addition. Percentage of cells containing aggregated CCUG100 and CCUG36 RNAs at different time points after Dox addition are displayed adjacent to corresponding time point. P values in A are 0.033356, 0.000392, 0.13575, 0.38821, and 0.124414 for 7, 17, 24, 36, and 48 hours, respectively. P values in B are as follows: 0.099972, 0.043283, 0.010648, 0.019951, and 0.039285 for 7, 17, 24, 36, and 48 hours respectively.