
Figure 9.
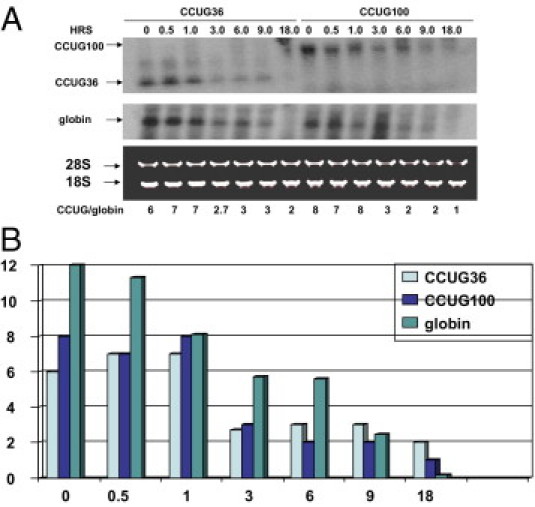
Stability of short and long CCUG repeats. A: Decay of CCUG36 and CCUG100 RNAs in CHO Tet-Off cells determined by Northern blotting. Time points for RNA collection after inhibition of CCUG transcription are shown on the top. CCUG36 and CCUG100 were co-transfected with β-globin as control. After hybridization with CAGG probe, the membrane was re-probed with the β-globin probe. Positions of CCUG36, CCUG100, and β-globin are shown by arrows on the left. Because the transfected plasmid (TRE-CCUG-GFP) also expressed GFP from an independent promoter, the efficiency of transfections was calculated by monitoring green cells. Plates with identical efficiency of transfections were used for experiments. Staining of 18S and 28S ribosomal RNAs shows equal loading of RNA. B: Bar graphs show the half life of the CCUG transcripts β-globin (after adjustment of intensities of CCUG repeats and β-globin to intensity of 18S RNA) as a summary of three independent experiments. X shows time (in hours) after silencing of CCUG transcription. Y shows ratios of intensities of β-globin and CCUG36/100 signals adjusted to the 18S RNA signal.