Fig. 4.
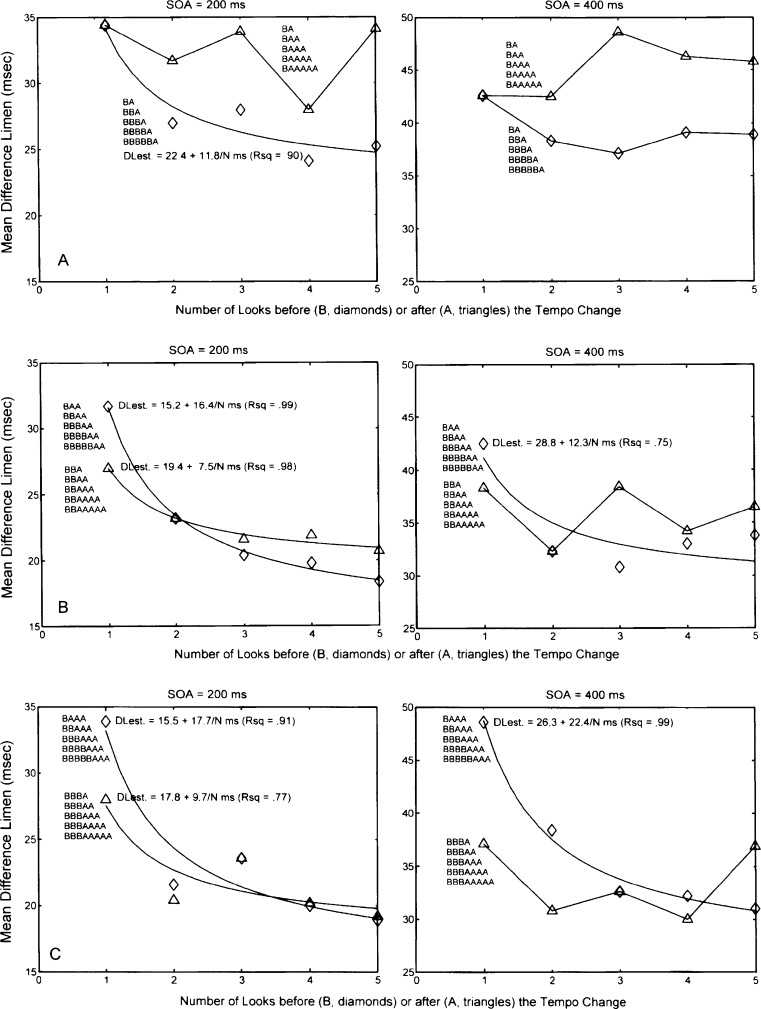
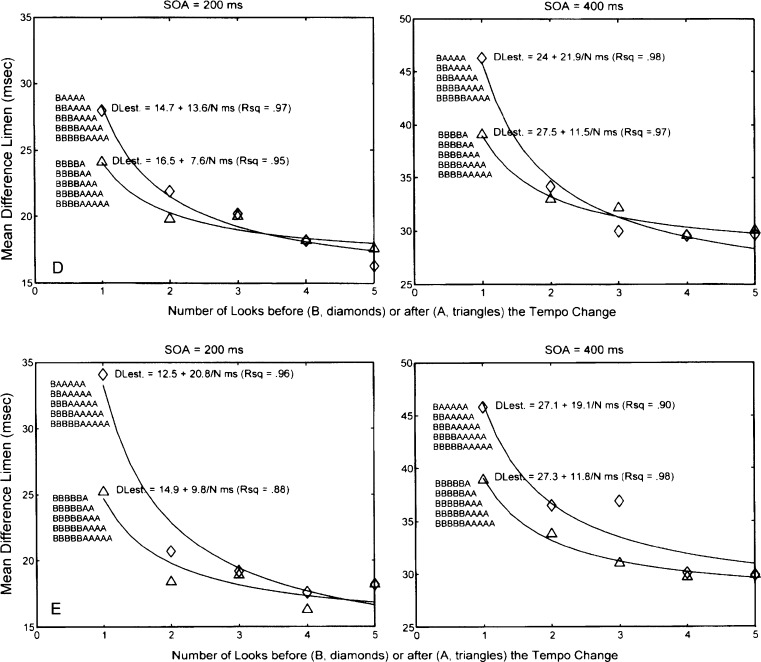
a Experiment 3. Mean difference limens at stimulus onset asynchronies of 200 (left panel) and 400 ms (right panel) for the sequences in which there is one interval before (B) or after (A) the tempo change and the number of A or B intervals increases from one to five. b Experiment 3. Mean difference limens at stimulus onset asynchronies of 200 (left panel) and 400 ms (right panel) for the sequences in which there are two intervals before (B) or after (A) the tempo change and the number of A or B intervals increases from one to five. c Experiment 3. Mean difference limens at stimulus onset asynchronies of 200 (left panel) and 400 ms (right panel) for the sequences in which there are three intervals before (B) or after (A) the tempo change and the number of A or B intervals increases from one to five. d Experiment 3. Mean difference limens at stimulus onset asynchronies of 200 (left panel) and 400 ms (right panel) for the sequences in which there are four intervals before (B) or after (A) the tempo-change and the number of A or B intervals increases from one to five. e Experiment 3. Mean difference limens at stimulus onset asynchronies of 200 (left panel) and 400 ms (right panel) for the sequences in which there are five intervals before (B) or after (A) the tempo change and the number of A or B intervals increases from one to five


