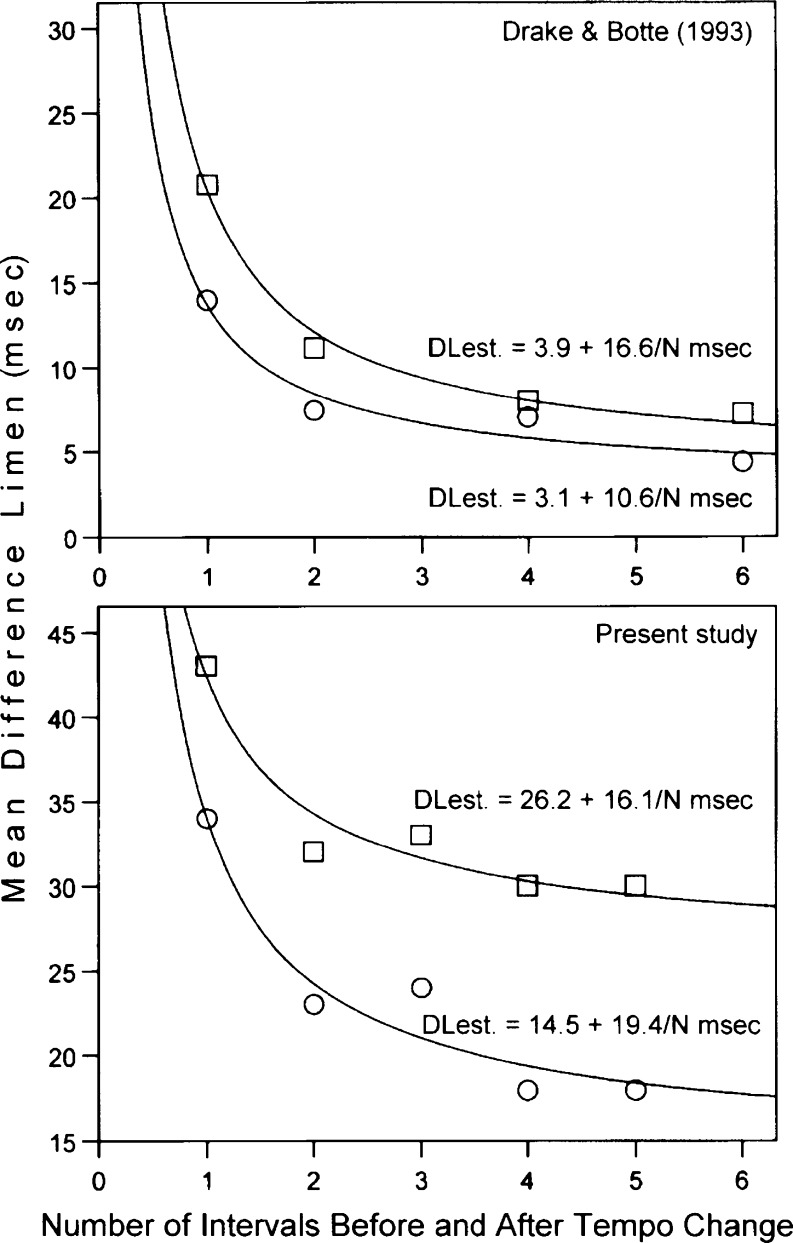
Fig. 6.
Experiment 3. Top panel: Observed mean difference limens (DLs) at stimulus onset asynchronies (SOAs) of 200 ms (circles) and 400 ms (squares) as a function of the number of intervals as reported by Drake and Botte (1993). The estimated reciprocal functions and their equations are inserted. Bottom panel: Observed mean DLs at SOAs of 200 ms (circles) and 400 ms (squares) as a function of the number of intervals as found in the present study. The estimated reciprocal functions and their equations are inserted

