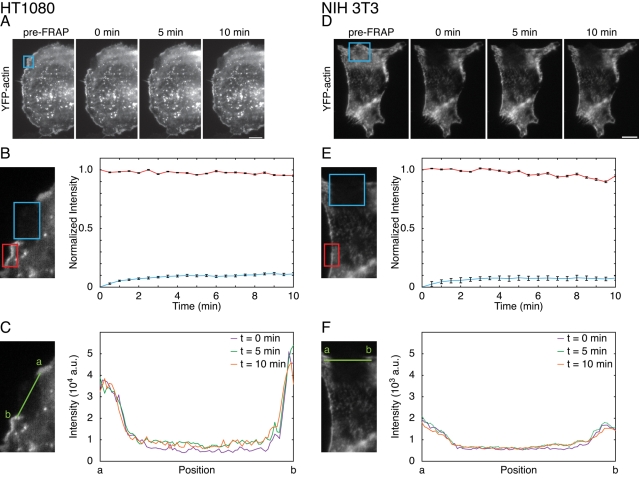
FIGURE 4:
JLY arrests actin dynamics in other mammalian cells. We used FRAP to analyze the ability of JLY to arrest actin depolymerization, polymerization, and rearrangements in YFP-actin expressing (A–C) HT1080 and (D–F) NIH 3T3 cells. Cells imaged in oblique fluorescence illumination were first pretreated with JLY, then photobleached in a rectangular region. (B and E) FRAP is a measure of actin assembly, and the fluorescence intensity of the nonbleached region estimates depolymerization. (C and F) The persistence of the bleached area can assay large-scale actin rearrangements. (B) In HT1080 cells, 11% new actin polymerization (blue box) and 5% depolymerization (red box) occurred in the 10 min following JLY treatment (n = 20). (C) The line profile (green line) between unbleached and bleached regions indicates no detectable actin rearrangements in the 10 min after photobleaching for JLY-treated HT1080 cells. (E) NIH 3T3 cells display 8% recovery (blue box) in the 10 min after photobleaching (n = 14). NIH 3T3 cells show 5% loss of filamentous actin signal over 10 min (n = 14), as evaluated by the loss of fluorescence intensity of the unbleached region of filamentous actin (red box). (F) A line profile (green line) of the borders between unbleached and bleached regions indicates no detectable actin rearrangements in the 10 min after photobleaching for JLY-treated NIH 3T3 cells. Error bars show SEM. Scale bar: 10 μm.

