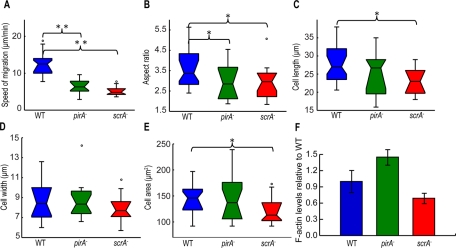
FIGURE 1:
Boxplots of kinematic parameters of chemotaxing wild-type (blue), pirA− (green), and scrA− (red) cells. (A) Speed of migration (μm/min). (B) Aspect ratio (cell length divided by cell width). (C) Cell length (μm). (D) Cell width (μm). (E) Area (μm2). Open circles represent outliers, and the notched section of the boxplots shows the 95% confidence interval around the median. Asterisks denote significant differences between distributions: *, 0.01 < pd < 0.05; **, pd < 0.01 (Wilcoxon rank sum test for equal medians). (F) Levels of F-actin of unstimulated cells normalized by the corresponding levels of unstimulated wild-type cells (F-actin assay). Error bars, SD from the average.

