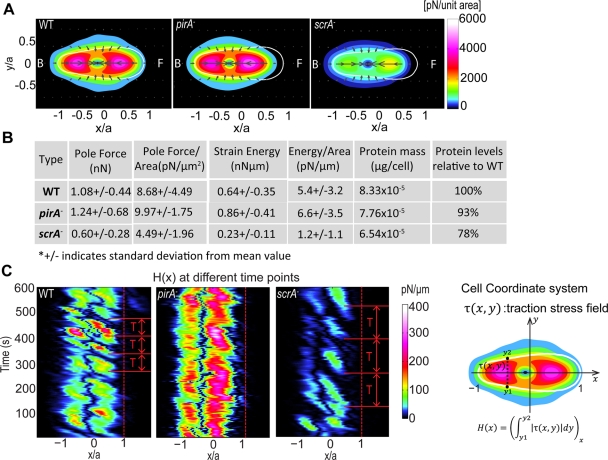
FIGURE 4:
(A) Average stress distribution pattern for wild-type (N = 14), pirA− (N = 17), and scrA− (N = 14) cells during chemotaxis on elastic polyacrylamide substrate. The contour maps show the average traction stress field, computed in a reference frame rotated to have the x- and y-axes coincide with the instantaneous principal axes of the cells. All dimensions are scaled with the length of their instantaneous major axis, a. Details of how the cell-coordinate system used in these plots is constructed can be found elsewhere (del Álamo et al., 2007; Alonso-Latorre et al., 2009). The colors indicate the magnitude of the stresses in pN/unit area, and the arrows indicate their direction. The white contours show the average shape of the cells in this reference frame. The front (F) of the cell corresponds to x > 0 and the back (B) to x < 0. (B) First five columns: cell type; average values of the pole forces obtained from the integration of the stresses in the front and the back halves of the cells (Fp); average magnitude of the pole forces normalized by the cell area (Fp/Ac); average strain energy (Us); average strain energy normalized by the cell area (Us/Ac). The last two columns show the average protein amount in μg/cell (DC assay) for each cell line and the average protein amounts in the mutants compared with that measured in wild-type cells. (C) Time evolution of the magnitude of the integral of the traction stresses along the width of the cell as a function of the position along the cell length for a representative wild-type, pirA−, and scrA− cell (sketch). Dashed lines indicate the cell front. The adhesion sites of the cell can be clearly seen, as well as the frequency of the formation of frontal adhesions, which coincides with the measured period of the motility cycle (T).

