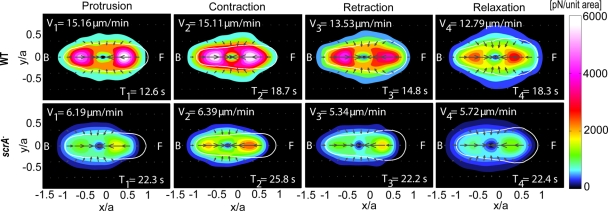
FIGURE 5:
Phase-averaged traction stress maps and cell shapes corresponding to the four phases of the motility cycle for wild-type (N = 14) and scrA− (N = 14) cells (for description of the contour maps see Figure 4A). The legends show the average durations, T1,…, T4, and the corresponding average speeds during each phase, V1,…, V4.

