
Figure 1.
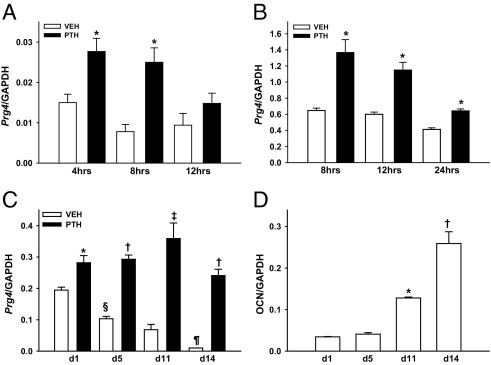
PTH regulation of Prg4 mRNA. A: Sixteen-week-old C57BL/6 wild-type mice were administered a single subcutaneous injection of PTH(1–34) (1 μg/g) or vehicle (VEH) (0.9% NaCl) control and then were sacrificed 4, 8, or 12 hours later; bone marrow was harvested for Prg4 mRNA expression analysis (n = 5 per group). *P < 0.05 versus VEH. B: C57BL/6 wild-type mouse-derived calvarial osteoblast cultures were administered a single treatment of PTH (10 nmol/L) or vehicle (VEH) (4 mmol/L HCl/0.1% SA) and were harvested 8, 12, or 24 hours later for Prg4 mRNA expression analysis (n = 7 per group). *P < 0.01 versus VEH. C: C57BL/6 wild-type mouse-derived calvarial osteoblast cultures, 1, 5, 11, and 14 days after plating, were administered a single treatment of PTH (10 nmol/L) or vehicle (VEH) (4 mmol/L HCl/0.1%BSA) treatment and were harvested 4 hours later for Prg4 mRNA expression analysis (n = 3 per group). *P < 0.05, PTH versus VEH; †P < 0.001, PTH versus VEH; ‡P < 0.01, PTH versus VEH; §P < 0.01, d5-VEH versus d1-VEH; ¶P < 0.05, d14-VEH versus d11-VEH. D: From the same cultures as in C, osteocalcin (OCN) mRNA expression was assessed as a marker of osteoblast differentiation. *P < 0.001, d11 versus d5; †P < 0.05, d14 versus d11. RNA was isolated and quantitative real-time PCR was performed to assess Prg4 mRNA and OCN mRNA expression (standardized to GAPDH levels). Relative quantification of data generated was determined using the standard curve method. Data are expressed as means ± SEM.