
Figure 3.
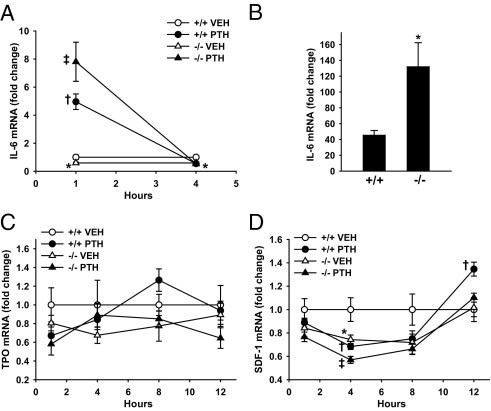
PTH regulation of gene expression. A, C, and D: Sixteen-week-old Prg4−/− mutant and Prg4+/+ wild-type mice were administered a single subcutaneous injection of PTH(1–34) (1 μg/g) or vehicle (VEH) (0.9% NaCl) control and then were sacrificed 1, 4, 8, or 12 hours later; bone marrow was harvested for gene expression analysis (n = 5 per group). RNA was isolated and quantitative real-time PCR was performed to assess mRNA expression of IL-6 (A), TPO (C), and SDF-1 (D), standardized to GAPDH levels. Relative quantification of data was determined using the comparative Ct method. B: Sixteen-week-old Prg4−/− and Prg4+/+ mice were untreated or administered a single subcutaneous injection of PTH(1–34) (1 μg/g) and then were sacrificed 1 hour later; calvariae were harvested for gene expression analysis (n = 5 per group). RNA was isolated and quantitative real-time PCR was performed to assess IL-6 mRNA expression (standardized to GAPDH levels). Values are expressed as treatment over no treatment control within treatment groups. A: Marrow IL-6 mRNA fold change at 1 and 4 hours after PTH injection. *P < 0.05, −/− VEH versus +/+ VEH; †P < 0.001, +/+ PTH versus +/+ VEH; ‡P < 0.001, −/− PTH versus −/− VEH. B: Calvarial IL-6 mRNA fold change at 1 hour after PTH injection. *P < 0.05, −/− PTH versus +/+ PTH. C: Marrow TPO mRNA fold change at 1, 4, 8, and 12 hours after PTH injection. D: Marrow SDF-1 mRNA fold change at 14, 8, and 12 hours after PTH injection. *P < 0.05, −/− VEH versus +/+ VEH; †P < 0.05, +/+ PTH versus +/+ VEH; ‡P < 0.01, −/− PTH versus −/− VEH. Data are expressed as means ± SEM.