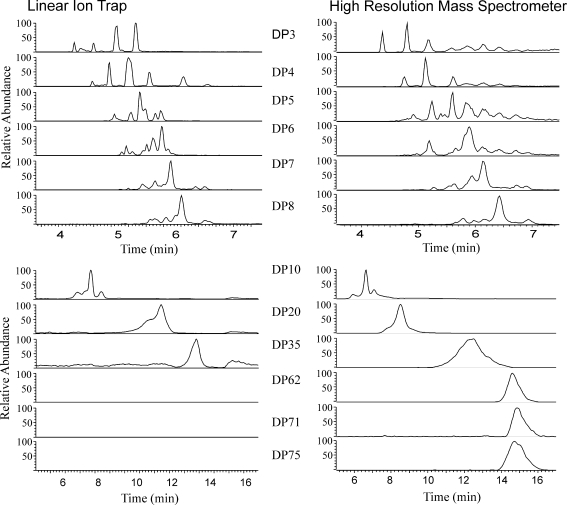
Fig. 5.
Extracted ion chromatograms for DP = 3, 4, 5, 6, 7, 8, 10, 20, 35, 62,71 and 75 showing the peaks obtained by the analysis of extracts of the same sample using either an ion trap (left) at unit resolution or the Exactive Orbitrap (right) at 100 K resolution. The traces are similar in the lower DP fructans, as would be expected. However, the larger DP fructans were not detectable using the ion trap

