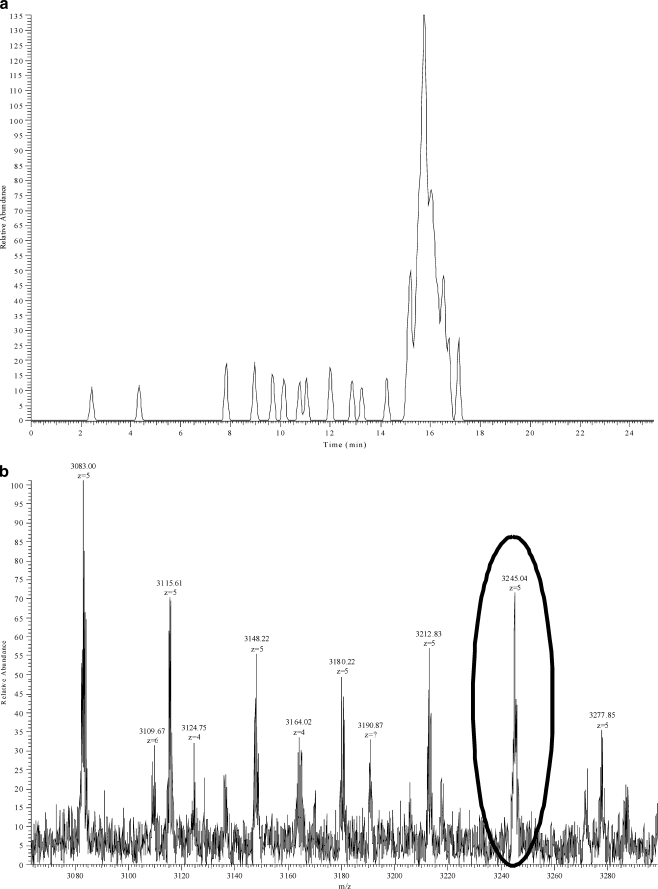
Fig. 6.
a Extracted ion chromatogram of a high-sugar grass ryegrass extract for a multiply charged ion from fructan of DP = 100, with a m/z 3,245.05 ± 0.032 (10 ppm) at 100 K resolution. The signal-to-noise ratio is approximately 7:1. b Mass profile at the retention time of 16 min with the ion from DP = 100 highlighted within the oval. The presence of larger fructans can be seen at a higher mass-to-charge ratio

