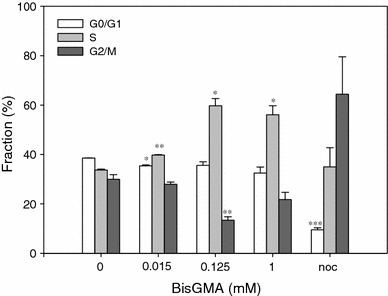
Fig. 8.

Cell cycle analysis in CCRF-CEM cells exposed to BisGMA for 1 h at 37°C. Percentage of cells in G0/G1 (white bars), S (light gray bars) and G2/M (dark gray bars) stage of cell cycle after treatment with BisGMA was presented. Nocodazole (noc) was used as a positive control. Data are expressed as means of three independent experiments, error bars denote SD; *P < 0.05; **P < 0.01; ***P < 0.001
