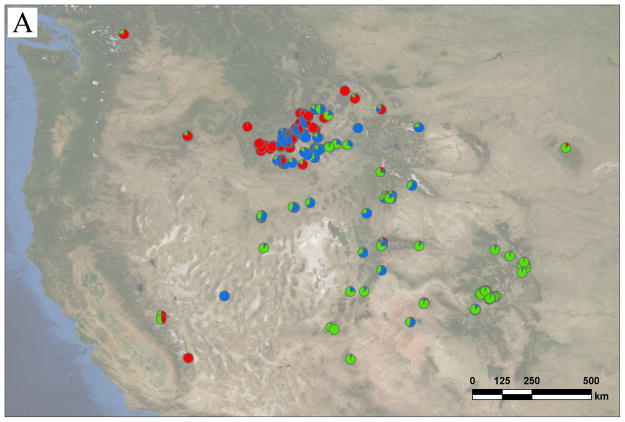
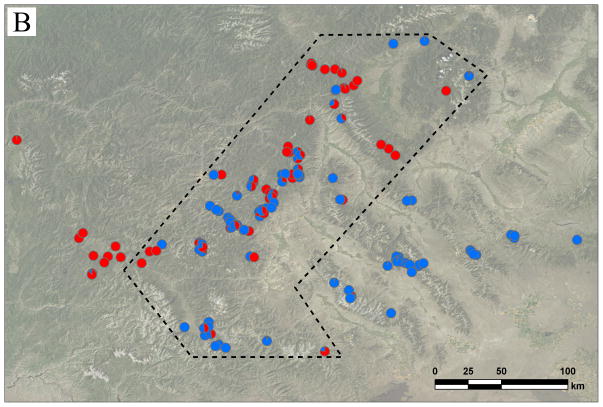
Figure 1. Collection sites and STRUCTURE results for Boechera stricta.
Each pie chart represents one individual randomly chosen from one location. Different colors in each pie chart represent STRUCTURE posterior probabilities that the individual belongs to each genetic group. A) The distribution of three genetic groups across western North America. Red = West; blue = North; green = South. Notice the narrow contact zone between West and East (comprised of North + South), and the clinal distribution between North and South genetic groups. B) The distribution of West and East genetic groups around the contact zone. Red = West; blue = East. Region encompassed by the dashed line is regarded as ‘sympatric zone’.


