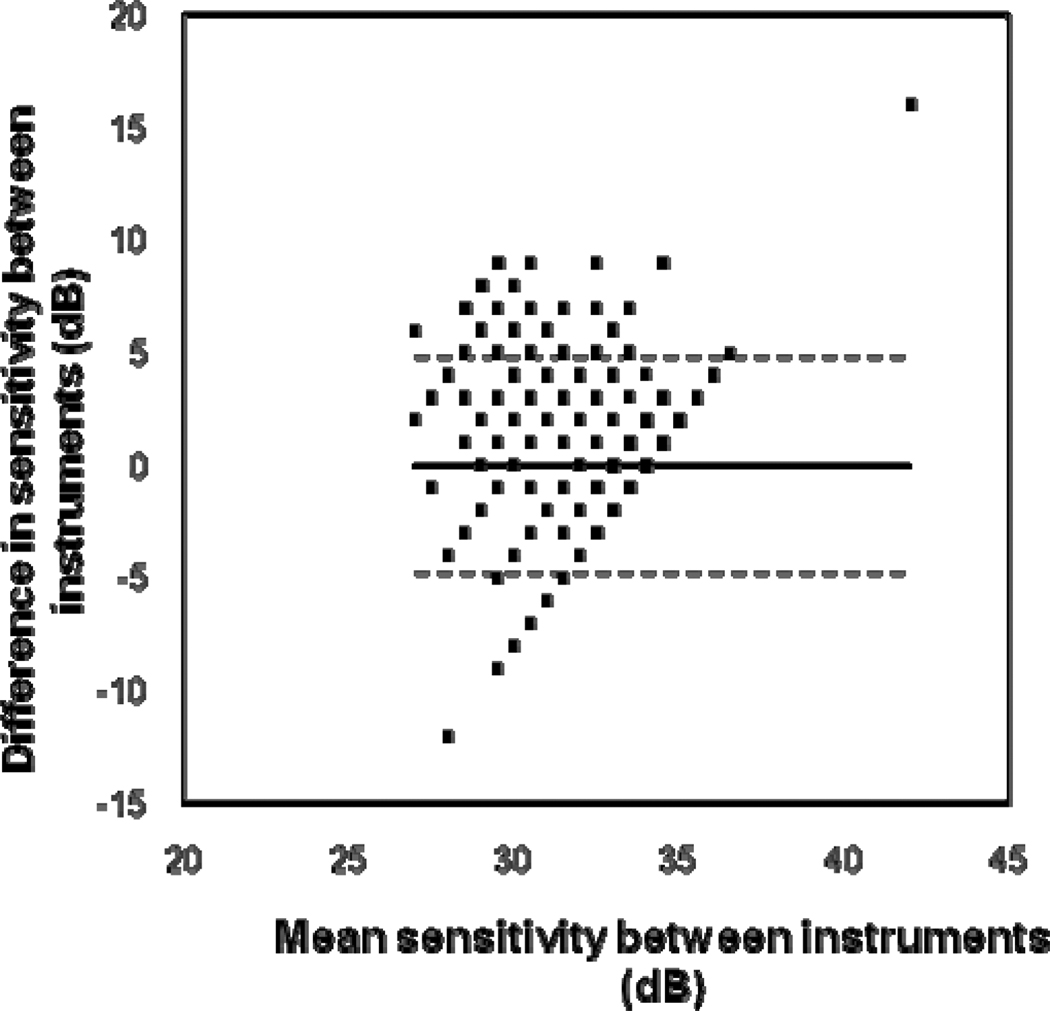
Figure 2.
Bland-Altman plot to show the difference in sensitivity values between instruments. The difference plotted along the ordinate shows the converted (HFA equivalent units) MP-1 sensitivities subtracted from the HFA sensitivities, for each stimulus location, for each patient. The relationship between the variability between instruments and magnitude of difference between instruments is shown. The horizontal solid line represents the mean difference and the dotted lines represent the 95% limits of agreement.

