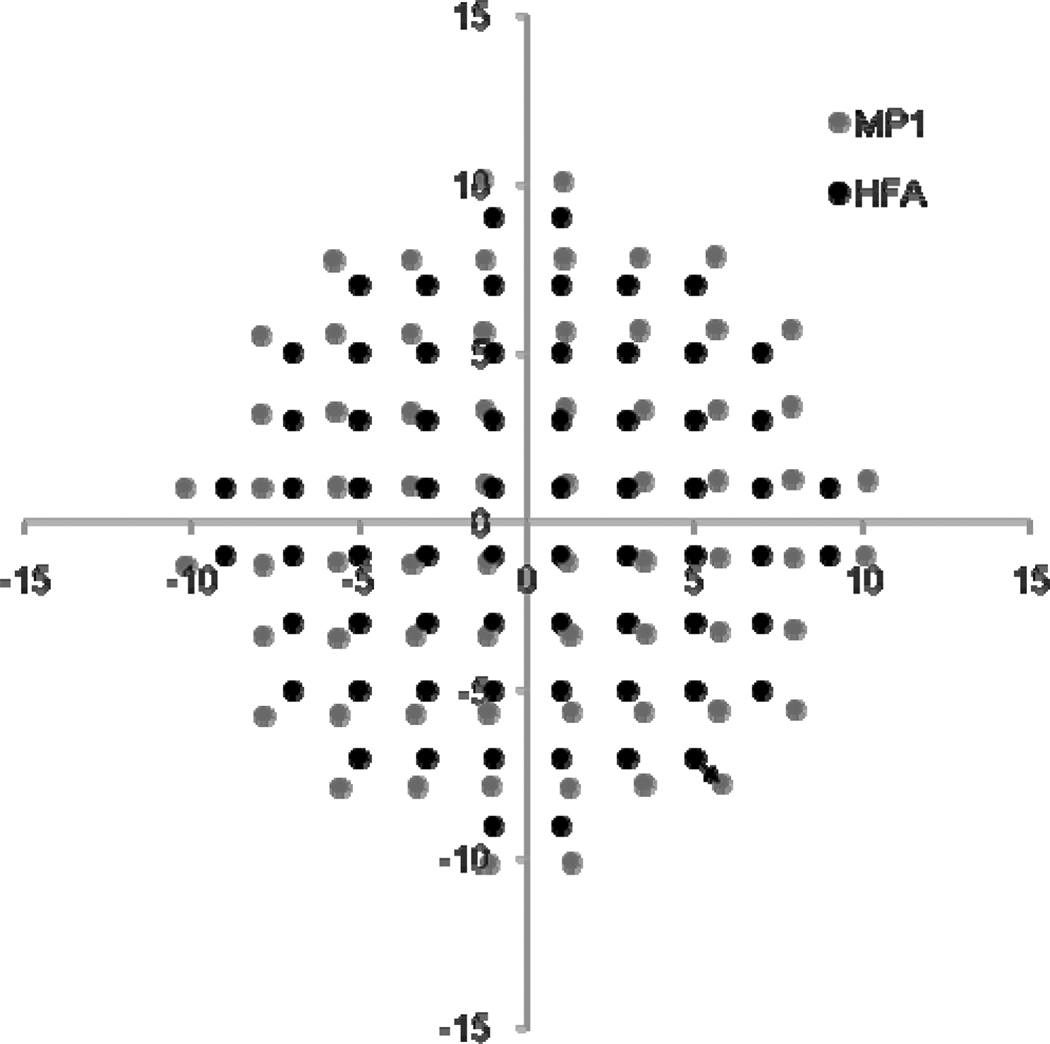
Figure 5.
The stimulus locations of the 10-2 pattern for the MP-1 and HFA are plotted according to the coordinates for each location, in degrees. The HFA stimulus locations have fixed coordinates. The mean value for the MP-1 coordinates for normal subjects is presented. Standard error values were less than the scatterplot point size. The arrow indicates the distance between corresponding given stimulus location points of the HFA and the MP-1.

