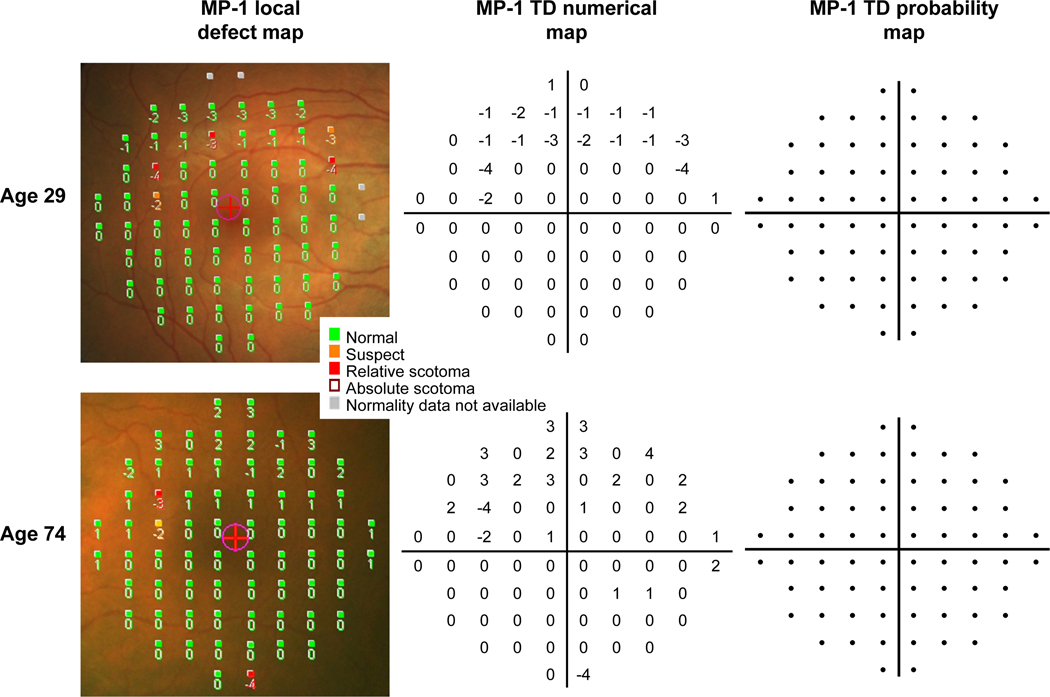
Figure 8.
Example of MP-1 maps from two normal subjects of different ages. The MP-1 local defect maps show the numerical deviations (in dB) to the age-matched normal sensitivities superimposed on the fundus image. These maps also indicate a classification of “suspect” or “relative scotoma” based on probability values derived from the existing MP-1 normative database, and a classification of “absolute scotoma” if the stimulus was not seen. MP-1 total deviation (TD) maps were generated from our own normative database, using the Bayesian model. The TD numerical maps indicate the deviations from the age-matched normal sensitivities (in dB) and the TD probability maps show probability defects. The two subjects in this example had probability defects on the local defect map, but both had no defects on the TD probability maps. A color verison of this figure is available online at www.optvissci.com.

